Basic diagnostics
Here you can find the list of basic diagnostic actions that may help you look for bug causes.
Engine
This section describes Engine related diagnostic.
Engine health
To check if the Engine Pods are in the Running state, run:
kubectl get pod -n capact-system -l app.kubernetes.io/name=engine
All the containers from Pods should be in the Running status. Restarts number higher than 1 may also indicate problems, e.g. not enough resource, lack of permissions, network timeouts etc.
Engine logs
If the Engine is healthy, you should be able to track any bug by checking the logs. To check the logs, run:
kubectl logs -n capact-system -l app.kubernetes.io/name=engine -c engine
To check the logs since a given time, use the --since-time flag, for example:
--since-time=2020-03-30T10:02:08Z
Checking Action status
To check the Action status, run:
kubectl get actions.core.capact.io ${ACTION_NAME} -n {ACTION_NAMESPACE} -ojsonpath="{.status}"
Checking Action status message
To check the Action status message, run:
kubectl get actions.core.capact.io ${ACTION_NAME} -n {ACTION_NAMESPACE} -ojsonpath="{.status.message}"
Checking rendered Action workflow
To check the rendered Action workflow before execution, run:
kubectl get actions.core.capact.io ${ACTION_NAME} -n {ACTION_NAMESPACE} -ojsonpath='{.status.rendering.action.args.workflow}'
NOTE: To display it in a more readable format, you can pipe it to jq.
Checking Action execution status
An Action is executed via Argo Workflows. To check the execution status you can use either Argo CLI or Argo UI:
Using command line.
Install the latest stable Argo CLI for version v2.x.x, and run:
argo get {ACTION_NAME} -n {ACTION_NAMESPACE}Using browser.
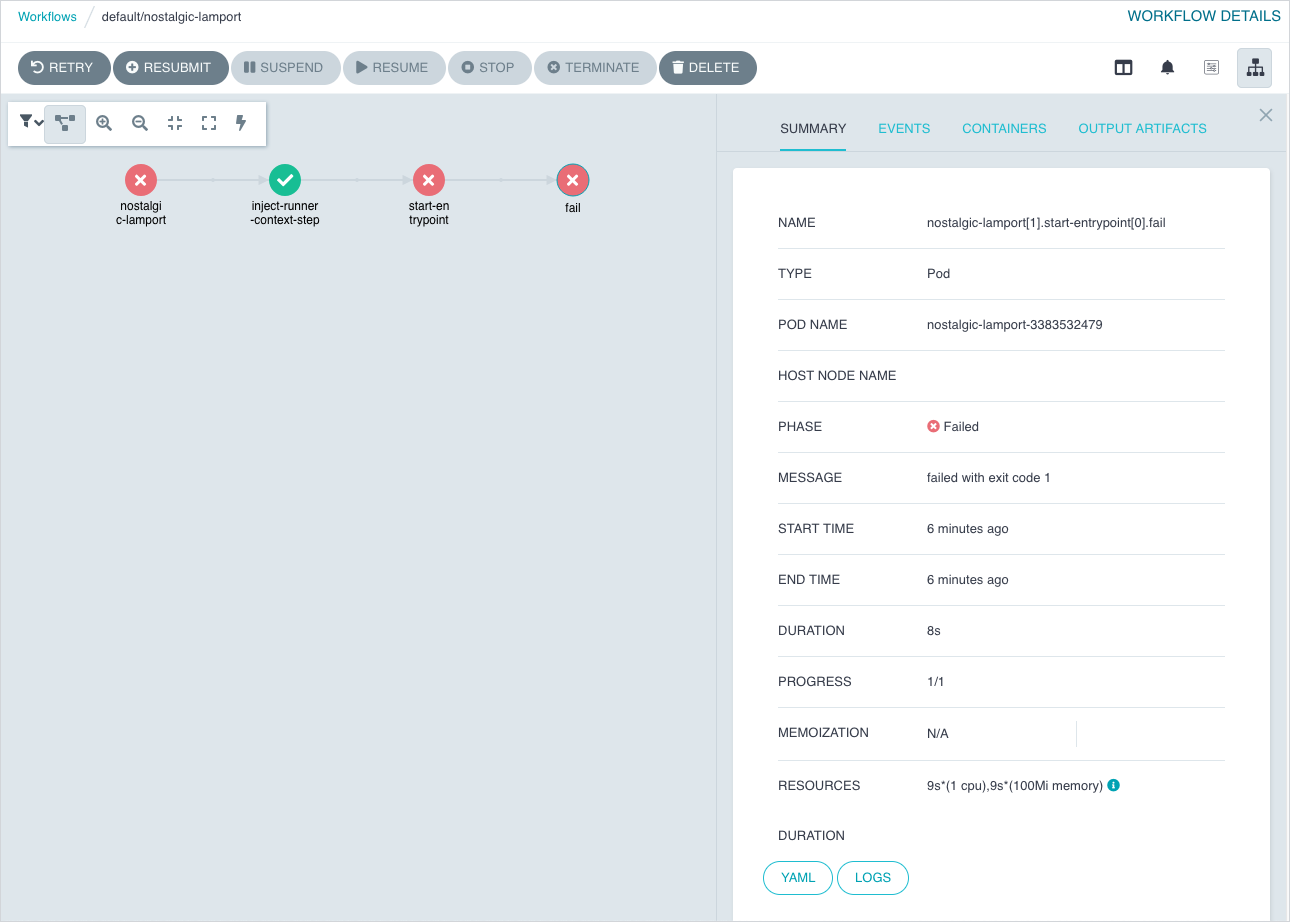
By default, the Argo UI is not exposed publicly. You need to port-forward the Service to your local machine:
kubectl -n capact-system port-forward svc/argo-server 2746Navigate to http://localhost:2746 to open Argo UI. Argo Workflow has the same name as the executed Action.
Checking cluster Policy
To check the cluster Policy definition, run:
kubectl get cm -n capact-system capact-engine-cluster-policy -oyaml
Gateway
This section describes Gateway related diagnostic.
Gateway health
To check if the Gateway Pods are in the Running state, run:
kubectl get po -n capact-system -l app.kubernetes.io/name=gateway
All the containers from Pods should be in the Running status. Restarts number higher than 1 may also indicate problems, e.g. not enough resource, lack of permissions, network timeouts etc.
Gateway logs
If the Gateway is healthy, you should be able to track any bug by checking the logs. To check the logs, run:
kubectl logs -n capact-system -l app.kubernetes.io/name=gateway -c gateway
To check the logs since a given time, use the --since-time flag, for example:
--since-time=2020-03-30T10:02:08Z
Public Hub
This section describes Public Hub related diagnostic.
Public Hub health
To check if the Public Hub Pods are in the Running state, run:
kubectl get po -n capact-system -l app.kubernetes.io/name=hub-public
All the containers from Pods should be in the Running status. Restarts number higher than 1 may also indicate problems, e.g. not enough resource, lack of permissions, network timeouts etc.
Public Hub logs
If the Public Hub is healthy, you should be able to track any bug by checking the logs. To check the logs, run:
kubectl logs -n capact-system -l app.kubernetes.io/name=hub-public -c hub-public
To check the logs since a given time, use the --since-time flag, for example:
--since-time=2020-03-30T10:02:08Z
Hub Populator logs
If the Public Hub is healthy, you should be able to track any bug by checking the logs. To check the logs, run:
kubectl logs -n capact-system -l app.kubernetes.io/name=hub-public -c hub-public-populator
To check the logs since a given time, use the --since-time flag, for example:
--since-time=2020-03-30T10:02:08Z
Checking if Public Hub is populated
Check if Hub Populator logs contain a message similar to:
{"level":"info","ts":1620895282.3582015,"caller":"register/ocf_manifests.go:107","msg":"Populated new data","duration (seconds)":235.525841306}. It means that manifests were populated successfully. If you get an error similar to:error: container hub-public-populator is not valid for pod capact-hub-public-84cc74bc66-pmkhpit means that the Public Hub Populator is disabled. To enable it, run:helm repo add capactio https://storage.googleapis.com/capactio-stable-charts
helm upgrade capact capactio/capact -n capact-system --reuse-values --set hub-public.populator.enabled=trueCheck if manifests can be fetched from the Public Hub. Install the latest stable Capact CLI, and run:
capact hub interfaces searchSuccessful response, should look similar to:
                           PATH                             LATEST REVISION                           IMPLEMENTATIONS
+---------------------------------------------------------+-----------------+-----------------------------------------------------------------+
  cap.interface.analytics.elasticsearch.install             0.1.0             cap.implementation.elastic.elasticsearch.install
                                                                              cap.implementation.aws.elasticsearch.provision
+---------------------------------------------------------+-----------------+-----------------------------------------------------------------+
  cap.interface.automation.concourse.change-db-password     0.1.0             cap.implementation.concourse.concourse.change-db-password
+---------------------------------------------------------+-----------------+-----------------------------------------------------------------+
...Check if manifest source is correct, run:
kubectl -n capact-system get deploy capact-hub-public -o=jsonpath='{$.spec.template.spec.containers[?(@.name=="hub-public-populator")].env[?(@.name=="MANIFESTS_PATH")].value}'Check the go-getter project to understand URL format.
Local Hub
This section describes Local Hub related diagnostic.
Local Hub health
To check if the Local Hub Pods are in the Running state, run:
kubectl get po -n capact-system -l app.kubernetes.io/name=hub-local
All the containers from Pods should be in the Running status. Restarts number higher than 1 may also indicate problems, e.g. not enough resource, lack of permissions, network timeouts etc.
Local Hub logs
If the Local Hub is healthy, you should be able to track any bug by checking the logs. To check the logs, run:
kubectl logs -n capact-system -l app.kubernetes.io/name=hub-local -c hub-local
To check the logs since a given time, use the --since-time flag, for example:
--since-time=2020-03-30T10:02:08Z
Checking if TypeInstance exists
To check if TypeInstance exists. Install the latest stable Capact CLI, and run:
capact typeinstance get {TYPE_INSTANCE_ID}
Successful response, should look similar to:
            TYPE INSTANCE ID                          TYPE                                 USES                                  USED BY                  REVISION
+--------------------------------------+---------------------------------+---------------------------------------+--------------------------------------+----------+
  d9975239-6483-444b-b7de-b9f5a47a710d   cap.type.helm.chart.release        ——                                      ——                                           1
+--------------------------------------+---------------------------------+---------------------------------------+--------------------------------------+----------+
Pod restart
When Pods are unhealthy, or if the operation processing is stuck, you can restart the Pod using this command:
kubectl delete po -n capact-system -l app.kubernetes.io/name={COMPONENT_NAME}